Gemini answers with a table. Which row is yours?
Gemini prefers structured comparisons and pulls from the same signals Google already reads about you. Sagentel runs your buyers' questions, records who makes the table, and shows which attribute lost you the row.




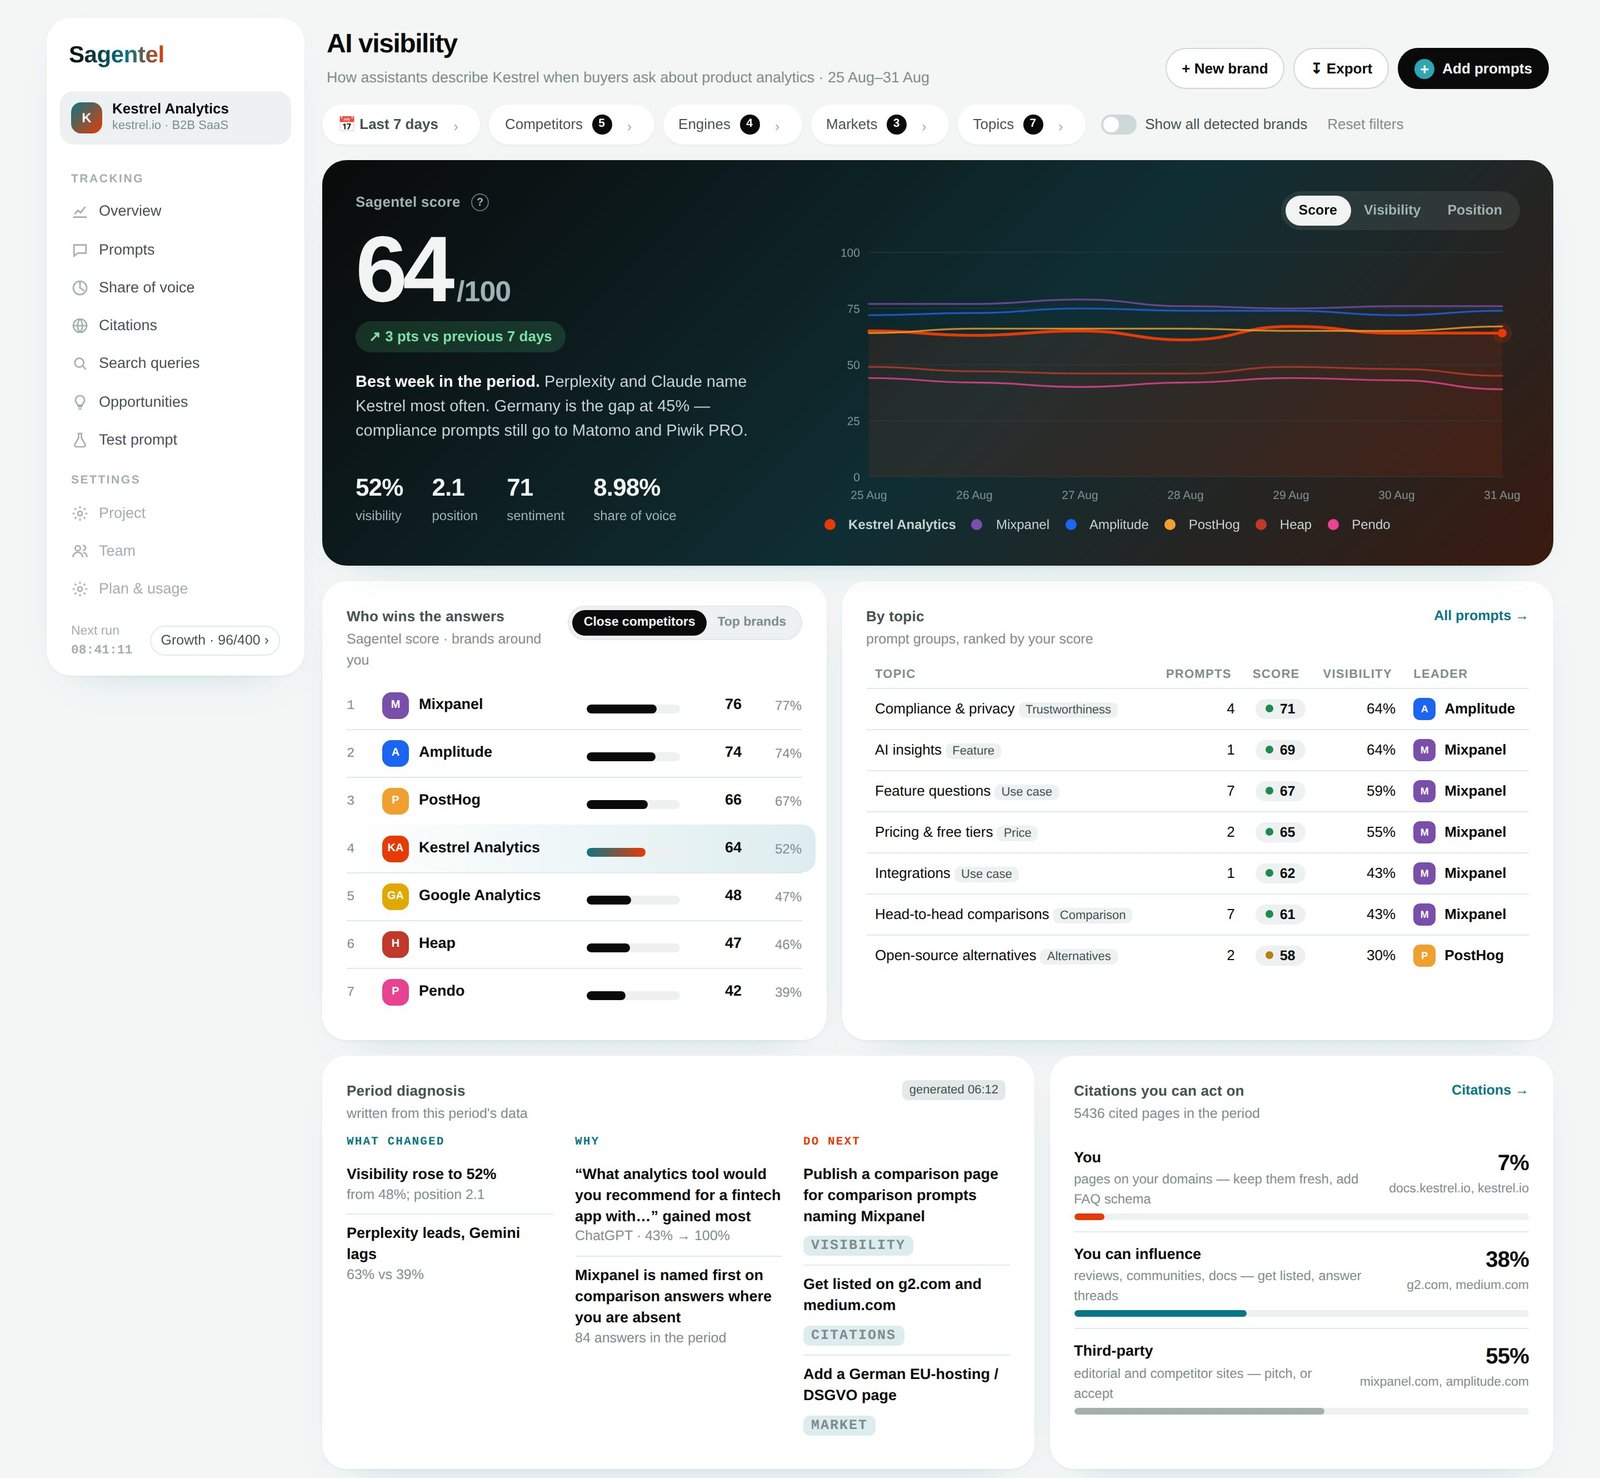
Gemini compares. So we measure the comparison.
Making the shortlist is half the job here. The other half is having every attribute available when the answer turns into a grid.
What decides who makes Gemini's table
Gemini sits closest to Google's own understanding of your business, which makes the work familiar in shape and different in emphasis.
Built for the people who own the number
Every blank comparison cell becomes a specific page change — not a general instruction to publish more.
Answers differ by market even for the same brand. Track each locale on its own so a strong home market stops masking a weak one.
Attribute fixes reported against both Gemini and AI Overviews, so one piece of work earns credit where it lands.
Questions we get asked
Is Gemini different enough from AI Overviews to track separately?
They share ancestry and often agree, but not always — the assistant handles longer, more conversational questions and follow-ups that never appear as a search query. We report both and flag where they diverge, because a divergence usually points at a specific missing attribute.
Why does the comparison table matter so much?
Because a blank cell reads as a worse answer than a bad one. Shoppers scanning a grid discount the option with missing information, even when the underlying product is stronger. Filling the cell is often a smaller job than winning the category.
Does structured data actually help here?
It helps as a clarity mechanism, not as a magic marker. The thing that matters is that the fact exists unambiguously somewhere a crawler can read it. Markup makes that easier; a plainly written specification table achieves much of the same.
Which questions do you run?
Comparison-shaped questions first, since that is Gemini's habit: compare these options, which is best for my situation, what should I choose instead, is it worth the extra. Around forty per category and market, plus the obvious follow-up to each.
How long until a fix shows up?
Attribute fixes tend to appear once the page is recrawled, so days to a few weeks. Positioning changes — being called the best value option — take longer, because they depend on other people publishing.
What does the first month look like?
Run one gives your row rate, the attribute coverage grid, and who fills the cells you leave empty. Run two confirms what is stable. You end with a page-by-page list of facts to publish, ordered by how many answers each one unblocks.
Your row is probably already there.
One domain, forty comparison questions, first results the same day — row rate, attribute coverage, and the pages that would close each gap.